
The Coors Field Effect, Quantified
How exit velocity, launch angle, and location reshape outcomes at mile high

Coors Field is often treated as a punchline by baseball enthusiasts—balls fly further, ERAs go to die, offensive production comes with a huge asterisk. But while it is easy to say “Coors inflates offense”, it is much harder—and more interesting—to ask a sharper question:
“What type of offense does Coors Field inflate?”
The casual fan will immediately think that the answer is simply higher altitude = less air resistance = more home runs. However, from 2023-2025, Coors Field ranks the 6th best place to hit home runs (106), according Baseball Savant’s park factor, coming behind Dodger Stadium (127), Great American Ball Park (123), Yankee Stadium (119), Citizens Bank Park (114), and Angel Stadium (113). Some hitter profiles quietly gain real run value at Coors Field; others look impressive in the box score but are less assisted by the altitude than you would expect.
In my first post on this PurpleBerry substack, I break down which batted balls are assisted by Coors Field the most. Using Statcast batted ball data, I group balls into different contact types defined by exit velocity, launch angle, and spray angle to elucidate where the jumps in offensive production are really coming from.
This is not about proving that Coors Field boosts offense — we already know that. It is about understanding where the boost is actually happening on the field and which hitter profiles benefit most from playing at 20th and Blake. These answers matter not just for understanding the Rockies’ environment, but for evaluating hitters, free agents, and roster decisions that look different once contact quality—not just the result—is taken seriously.
This is the first in a longer series aimed at building a Rockies-specific analytical lens for evaluating offense at Coors Field. In subsequent posts, we will use this foundation to evaluate specific hitters, pitchers, free agents, lineups, etc. For now, the goal is simple: establish what Coors Field really rewards—and what it does not.
Methods
The goal of this analysis is to isolate how identical batted-ball contact translates differently at Coors Field compared to other MLB parks. To do that, I condition on contact quality first, then compare outcomes by location.
Data
I use Statcast batted-ball data from the 2020–2025 regular seasons, restricting the sample to balls put into play. Each batted ball is grouped into a “contact bin” using three characteristics that largely define how a ball travels:
Exit velocity (EV) from <80, 80-85, 85-90, 90-95, 95-100, 100-105, 105-110, 100+ mph
Launch Angle (LA) from <10 (ground ball), 10-25 (line drive), 25-50 (fly ball), 50+ (popup) degrees
Spray Angle (SA) from -45 to -27 (left field), -27 to -9 (left center), -9 to 9 (center field), 9 to 27 (right center), 27 to 45 (right field) degrees
Each bin is then split by location: batted balls hit at Coors Field versus those hit in all other MLB parks. This lets us compare like-for-like contact and isolate the effect of the park itself.
Outcome probabilities
Within each contact bin, I compute how often that type of contact turns into: a single, double, triple, home run, or out. These are expressed as probabilities — for example, the chance that a ball hit with a given EV, LA, and SA becomes a double at Coors Field or at any other park. The difference between those two probabilities shows how much Coors Field factors into the outcome for that specific contact profile.
Expected bases
Rather than focusing on any single result (like home runs alone), I summarize offensive value using expected bases per ball in play:
Bases = 4 * P(HR) + 3 * P(3B) + 2 * P(2B) + 1 * P(1B)
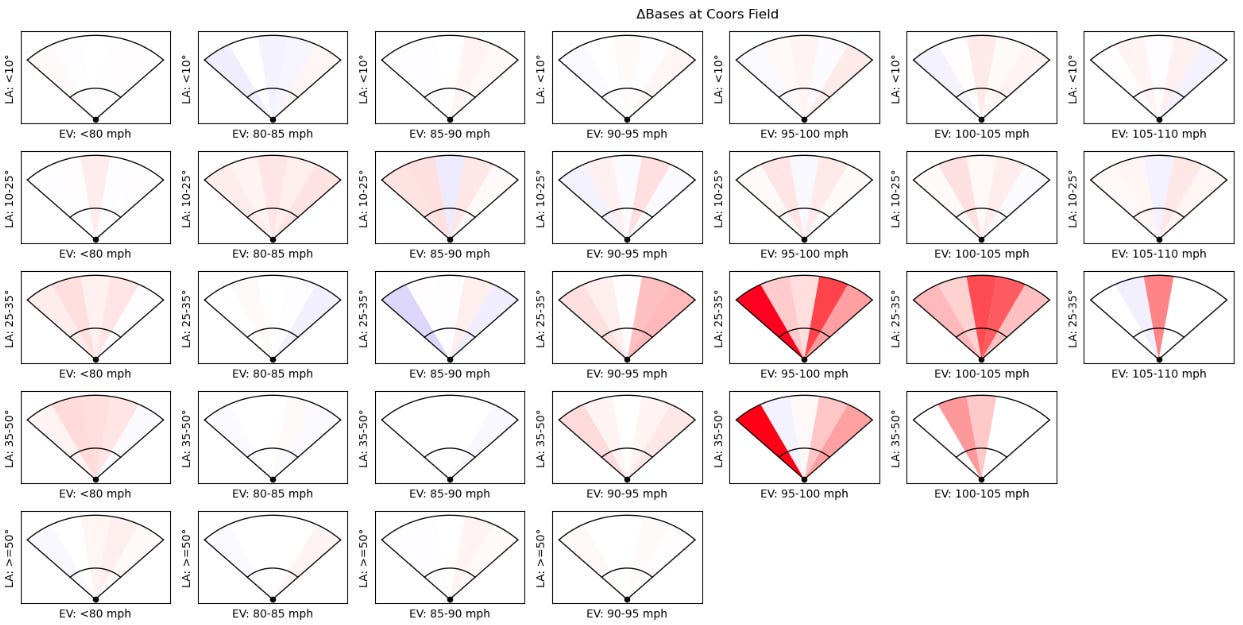
The main metric throughout this piece is ΔBases — the difference in expected bases between Coors Field and all other parks for the same contact type. Positive values indicate contact that gains value at altitude; negative values indicate contact that translates worse than average.
Limitations
This analysis intentionally ignores player identity, batter handedness, defensive positioning, and weather. The goal here isn’t to project individual performance, but to understand what kinds of contact Coors Field actually rewards. Those additional layers will be explored in future work.
Unless otherwise noted, percentage changes refer to absolute changes in outcome probability, not relative increases.
Results
Some of these results will be obvious. For example, balls hit 105+ mph do not really need a boost from altitude. However, the story becomes more interesting once we move away from elite exit velocities and look at the margins. Better yet, the direction of the ball is more telling of which balls will fall for hits versus be caught to retire the sides.
How hard is hard enough at mile high?
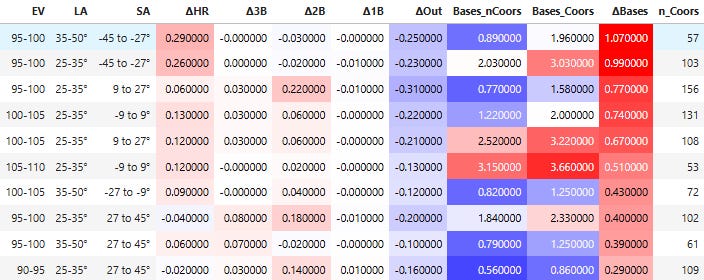
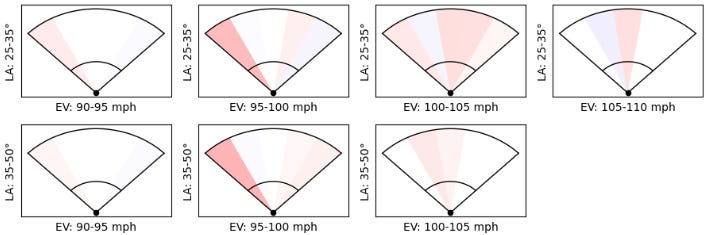
The best way to maximize slugging—at almost any ballpark—is to hit the ball 105+ mph off with a launch angle between 25-35° off the bat to left-center field. We expect this contact to result in 3.82 bases, on average. Not at Coors… at Coors, balls hit between 100-105 mph with the same launch angle to left field produces more expected bases (3.95).
This is the theme of our first finding—Rockies don’t have to hit the ball that hard at home. While clicking with a hanging curveball for a 105+ mph exit velocity will create offense, hitters at Coors Field see the most productivity gain on balls hit between 95-100 mph. The top three bins for ΔBases are all struck < 100 mph, with large differences in the number of balls that hit the seats. For example, a ball hit 96 mph at a 45° launch angle to left field has a 25-30% greater chance of leaving the yard at mile high.
Direction matters
At Coors Field, direction often matters as much as raw power — especially in the 90–100 mph range where small changes in contact flip outcomes. The outcome of this type of contact varies depending on whether the ball is headed to the right or left of the center field fountains. As we have discussed, righty pull hitters should expect to see a jump in their home run numbers if they target the Toyota truck parked over the left field concourse.
Otherwise, batted balls see improvements in all areas of slug when headed towards the manual scoreboard in right field. Doubles, in particular, are 14-22% more common towards right field and the right-center gap from exit velocities 90-100 mph.
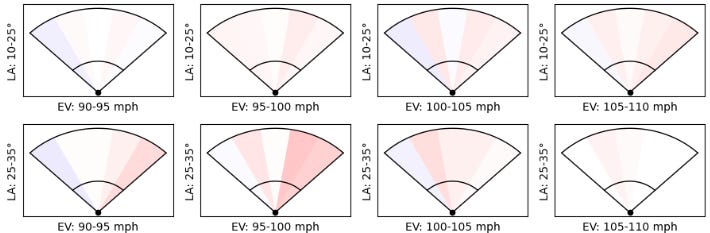
This phenomenon helps explain why Coors Field is such a great place to hit. Not all batted balls turn into home runs; productivity is quietly created with good contact over the first and second basemen.
Hitters that use the big part of the field (left center to right center) don’t see quite as big a lift from the thinner air until balls are flying over 100+ mph. But when hitters consistently generate triple digit exit velocities towards center field, they enjoy a 12-13%, ~3%, 2-6% boost in home runs, triples, and doubles, respectively.
Where Coors Field hurts…
Short answer: not in many places. But for the sake of the discussion, I will highlight two contact types that result in a >5% frequency of being caught at Coors Field.
Soft line drives hit 85-90 mph at a 25-35° or 10-25° launch angle to right and center field result in more outs and a difference in expected bases of -16% and -8%, respectively. These may be a couple examples where a few extra feet of carry send the batter back to the dugout instead of first base.
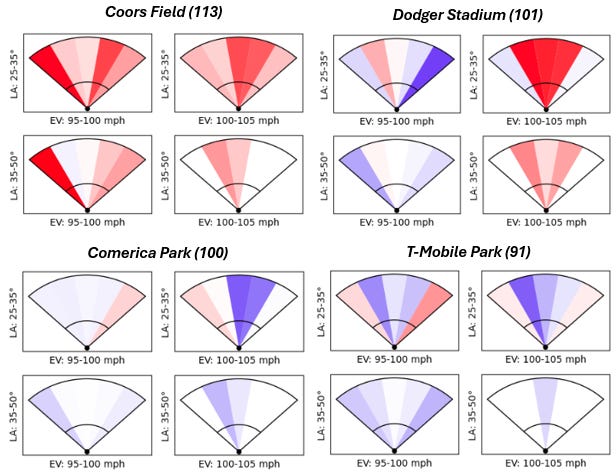
How does Coors Field compare to other parks?
There’s no surprise that Coors Field is the no. 1 overall ballpark for hitters (and therefore the worst for pitchers), according to Baseball Savant’s park factor ratings from 2023-2025. Just for fun, take a look at how the key contact types that are boosted at Coors grade out at some other ballparks.
Final Thoughts
Coors Field doesn’t simply reward power — it rewards specific kinds of contact. The thin air matters most at the margins, where balls that are merely “well hit” elsewhere turn into extra bases in Denver.
But what does this all mean? Should the Rockies prioritize power pull hitters? Fast gap-to-gap guys with high bat speeds? Stock up on groundball pitchers? Maybe…
There’s a lot more to unpack, here. Besides the thinner air of the Rocky Mountains, Coors Field’s dimensions, defensive alignment, and minimized pitch break all play into these result to some extent.
In future posts, we will build off this framework to further investigate the phenomenon of playing baseball at mile high, and dive into which current and future players might make the best (or worst) match for wearing purple at Coors Field.